Skip to content
  • Home
  • Resume
  • Project Development
  • Data Analytics
  • Data Visualization

Data Visualization

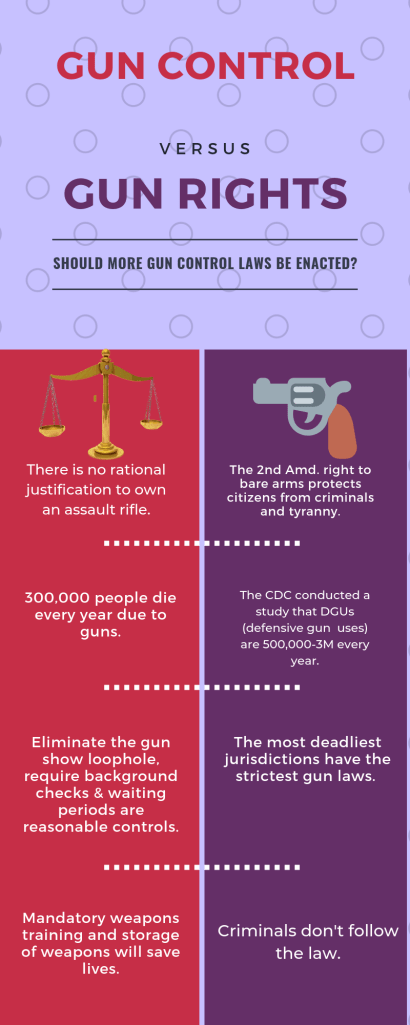
Excel used to conduct tests on Data. The article suggests that objects trigger aggressive behavior. The tests on the data suggests a correlation, but of no significance. The above visualization was created to summarize the debate succinctly.

guns-data-set2finalDownload

Article for the Gun Study visualization.

gunstudyarticleDownload

Share this:

  • Click to share on X (Opens in new window) X
  • Click to share on Facebook (Opens in new window) Facebook
Like Loading...
Powered by WordPress.com.
    • kathleendeboer9.com
    • Sign up
    • Log in
    • Copy shortlink
    • Report this content
    • Manage subscriptions
 

Loading Comments...
 

    %d